As fire crews and military personnel battle wildfires in British Columbia and the Northwest Territories, mapping data from NASA shows where conditions are improving and where they are expected to worsen.
Created by NASA and the U.S. Department of Agriculture Forest Service, the Fire Information for Resource Management System U.S./Canada (FIRMS) shows real-time updates of active wildfires burning across Canada and the U.S.
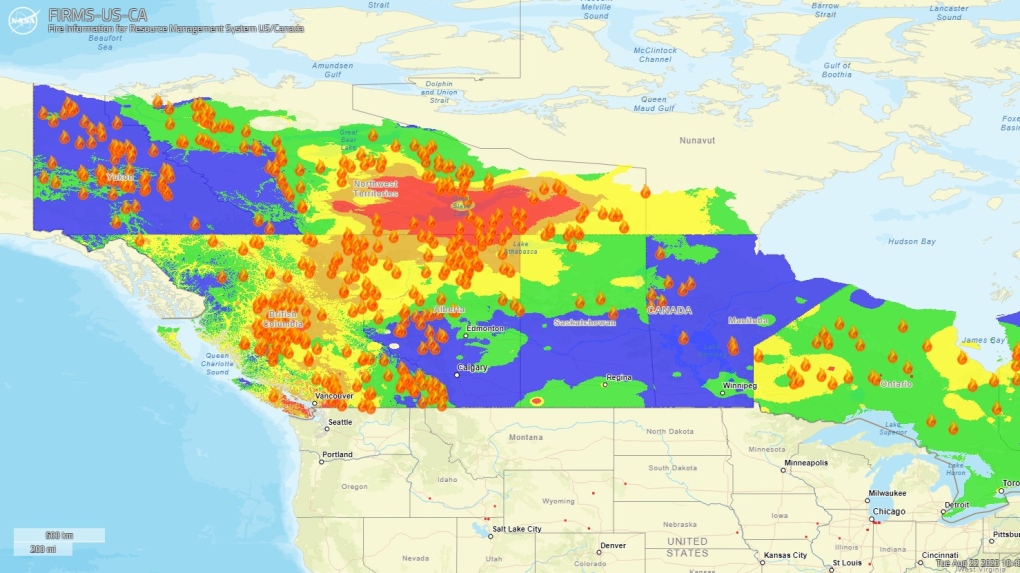
The latest mapping data, as of Tuesday, continues to show orange flame icons in most of the west, northwest and central regions of Canada, indicating active fires larger than 404 hectares or about four square kilometres. Large wildfires are also burning in Ontario and Quebec.
 As fire crews and military personnel battle wildfires in British Columbia and the Northwest Territories, mapping data from NASA shows where conditions are improving and where they are expected to worsen. (FIRMS)
Southern regions in the Northwest Territories, bordering Alberta, can be seen with worsening conditions as red square icons surround the area, indicating active "thermal anomalies."
On Saturday, there was visibly less and more sparse fire activity in the region compared to today. According to the latest update from officials in the territory, dry heat is expected to hit the Fort Smith community with temperatures reaching as high as 27 C.
The areas with the most thermal anomalies are near Fort Smith and Hay River, N.W.T., and the Fort McMurry, Alta., forest area, where one of three out-of-control wildfires is burning in the province, according to the Alberta Wildfire status dashboard.
 FIRMS mapping data shows thermal anomalies detected in the Northwest Territories on Saturday, Aug. 19, (left) and on Tuesday, Aug. 22 (right). (FIRMS)
The FIRMS mapping data also shows which areas have a forecasted fire danger based on their daily weather conditions, including humidity and wind and how those will affect fire activity.
According to the data, most of the Northwest Territories, south of Yellowknife, is covered in red indicating "fast-spreading" or "very difficult to control" fires. The rest of the territory is either in orange, meaning the fires are "high-intensity," or yellow meaning the fires are "moderate to vigorous."
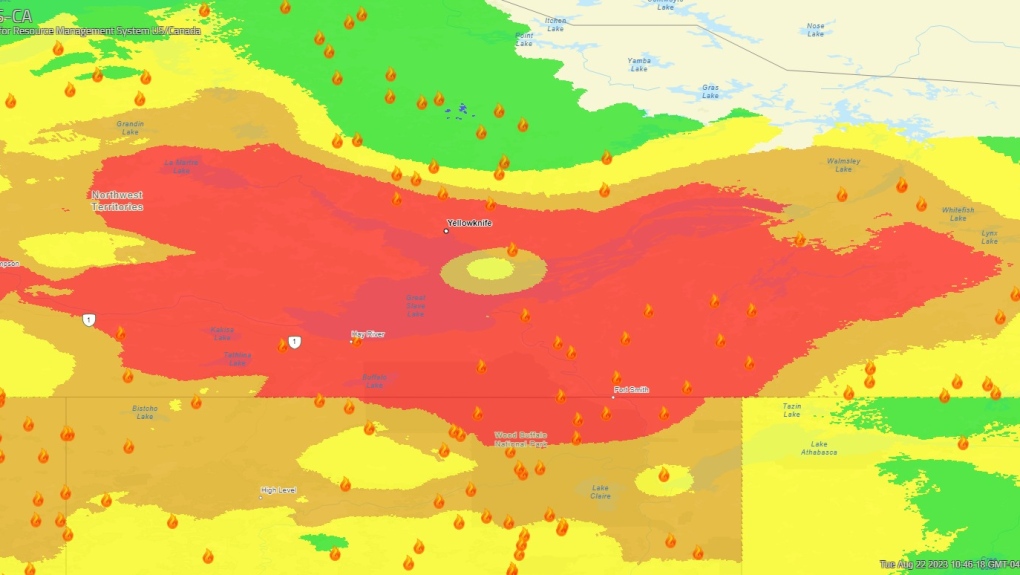 FIRMS mapping data shows forecasted fire danger in the Northwest Territories as of Tuesday, Aug. 22. (FIRMS)
In British Columbia's fire epicentre, Kelowna, improvements can be seen in comparison to data mapping from Saturday, when a sea of red icons covered both sides of Okanagan Lake. Today, those thermal anomalies are only detected in the outer regions of the lake as fire crews made progress over the last few days.
 FIRMS mapping data shows thermal anomalies detected in British Columbia on Saturday, Aug. 19, (left) and on Tuesday, Aug. 22 (right). (FIRMS)
Despite this, British Columbia is still not in the clear as the forecasted fire danger shows the province in mostly yellow and orange, with southern B.C. in red as the wildfires reached Vancouver Island over the weekend.
 FIRMS mapping data shows forecasted fire danger in British Columbia as of Tuesday, Aug. 22. (FIRMS)
As of Monday, there are 238 active wildfires in the Northwest Territories and more than 68 per cent of the territory's entire population has left. According to British Columbia's wildfires map, there are currently 377 active wildfires as of Tuesday.
With files from Natasha O'Neill and Daniel Otis.