
More than 115 cases of eye damage reported in Ontario after solar eclipse
More than 115 people who viewed the solar eclipse in Ontario earlier this month experienced eye damage after the event, according to eye doctors in the province.


With greenhouse gas emissions usually reported at the global or national level, it can be difficult to determine their prevalence in local communities.
Until now, that is.
A new tool developed by scientists at the Johns Hopkins Applied Physics Laboratory tracks the spread of greenhouse gases such as carbon dioxide at the scale of a city block.
Using artificial intelligence and satellite imaging, researchers are able to provide estimates of vehicle emission levels across 500 cities worldwide.
CTV News Science and Technology Specialist Dan Riskin has more in this month’s Riskin Report.
More than 115 people who viewed the solar eclipse in Ontario earlier this month experienced eye damage after the event, according to eye doctors in the province.
A Sherwood Park family says their new house is uninhabitable. The McNaughton's say they were forced to leave the house after living there for only a week because contaminants inside made it difficult to breathe.
A man has been handed a lengthy hunting ban and fined thousands of dollars for illegally killing a grizzly bear, B.C. conservation officers say.
The B.C. NDP has asked the federal government to recriminalize public drug use, marking a major shift in the province's approach to addressing the deadly overdose crisis.
The Ontario Provincial Police (OPP) says it's investigating an interaction between a uniformed officer and anti-Trudeau government protestors after a video circulated on social media.
An emergency slide fell off a Delta Air Lines jetliner shortly after takeoff Friday from New York, and pilots who felt a vibration in the plane circled back to land safely at JFK Airport.
Sophie Gregoire Trudeau says there is 'still so much love' between her and Prime Minister Justin Trudeau, as they navigate their post-separation relationship co-parenting their three children.
George Mallory is renowned for being one of the first British mountaineers to attempt to scale the dizzying heights of Mount Everest during the 1920s. Nearly a century later, newly digitized letters shed light on Mallory’s hopes and fears about ascending Everest.
A loud explosion was heard across Hamilton on Friday after a propane tank was accidentally destroyed and detonated at a local scrap metal yard, police say.

A Regina police officer was injured after another officer's gun was accidentally fired while conducting a search warrant early Friday morning.
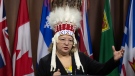
After the Assembly of First Nations' national chief complained to Air Canada about how staffers treated her and her ceremonial headdress on a flight this week, she says the airline responded by offering a 15 per cent discount on her next flight.
A CSIS officer's allegations that she was raped repeatedly by a superior in agency vehicles set off a harassment inquiry, but also triggered an investigation into her that concluded the alleged attacks were a “misuse” of agency vehicles by the woman.
Environmentalist groups are sounding the alarm about a steep increase in the number of pro-plastic lobbyists at the UN pollution talks taking place this week.
A loud explosion was heard across Hamilton on Friday after a propane tank was accidentally destroyed and detonated at a local scrap metal yard, police say.
The Ontario Provincial Police (OPP) says it's investigating an interaction between a uniformed officer and anti-Trudeau government protestors after a video circulated on social media.

Columbia University's embattled president came under renewed pressure on Friday as a campus oversight panel sharply criticized her administration for clamping down on a pro-Palestinian protest at the Ivy League school.
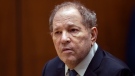
Harvey Weinstein will appear in a New York City court next week, the first step in potentially retrying the film mogul after his 2020 rape conviction was overturned.
U.S. President Joe Biden said Friday that he is willing to debate his presumptive Republican opponent, Donald Trump, later this fall – his most definitive comment yet on the issue.
The military horses that bolted and ran loose when spooked by construction noise in central London earlier this week "continue to be cared for and closely observed," the British Army said Friday.
An emergency slide fell off a Delta Air Lines jetliner shortly after takeoff Friday from New York, and pilots who felt a vibration in the plane circled back to land safely at JFK Airport.
An American Airlines flight attendant was indicted Thursday after authorities said he tried to secretly record video of a 14-year-old girl using an airplane bathroom last September.

Sophie Gregoire Trudeau says there is 'still so much love' between her and Prime Minister Justin Trudeau, as they navigate their post-separation relationship co-parenting their three children.
The federal government is earmarking $3 million for production of drones in Ukraine in support of Kyiv's fight against Russia's invasion.
After the Assembly of First Nations' national chief complained to Air Canada about how staffers treated her and her ceremonial headdress on a flight this week, she says the airline responded by offering a 15 per cent discount on her next flight.

A Sherwood Park family says their new house is uninhabitable. The McNaughton's say they were forced to leave the house after living there for only a week because contaminants inside made it difficult to breathe.
Breast cancer rates are rising in Canada among women in their 20s, 30s and 40s, according to research by the University of Ottawa (uOttawa).
More than 115 people who viewed the solar eclipse in Ontario earlier this month experienced eye damage after the event, according to eye doctors in the province.

TikTok is in the crosshairs of authorities in the U.S., where a new law threatens a nationwide ban unless its China-based parent ByteDance divests. Here are the places that have partial or total bans on TikTok.
The Hubble Space Telescope has captured a stunning new image of the glowing gas ejected from a dying star, which in this case happens to resemble a 'cosmic dumbbell.'
After years of delays and a dizzying array of setbacks during test flights, Boeing’s Starliner spacecraft is finally set to make its inaugural crewed launch.

When Art Kinarthy embarked upon this quest, he never could have imagined where it would ultimately lead.
A federal judge in Manhattan dismissed for good a lawsuit accusing Aerosmith lead singer Steven Tyler of sexually assaulting a former teenage model twice in one day in the mid-1970s.
A pair of Montreal designers' work has now been viewed over 41 million times. Taylor Swift dons a Victorian throwback black gown in her latest music video, 'Fortnight', designed by UNTTLD due Simon Belanger and Jose Manuel Saint-Jacques.

The federal and Quebec governments are spending close to $100 million to boost the country's manufacturing capacity for semiconductors, which are vital in technologies ranging from artificial intelligence to quantum computing.
The number of vacant jobs in Canada increased in February, while monthly payroll employment decreased in food services, manufacturing, and retail trade, among other sectors.
Ford’s electric vehicle unit reported that losses soared in the first quarter to US $1.3 billion, or US$132,000 for each of the 10,000 vehicles it sold in the first three months of the year.

Take an illustrated look back at the culinary history of Winnipeg.
An idyllic 453-acre private island is up for sale off the west coast of Scotland and it comes with sandy beaches, puffins galore, seven houses, a pub, a helipad and a flock of black-faced sheep.
During a special winner celebration near their hometown, Doug and Enid shared the story of how they discovered they were holding a Lotto Max ticket worth $70 million and how they kept this huge secret for so long.

As if a 4-0 Edmonton Oilers lead in Game 1 of their playoff series with the Los Angeles Kings wasn't good enough, what was announced at Rogers Place during the next TV timeout nearly blew the roof off the downtown arena.
Maple Leafs winger William Nylander appears on course to suit up for the first time in this spring's Stanley Cup playoffs.
Philadelphia 76ers All-Star centre Joel Embiid has been diagnosed with Bell’s palsy, a form of facial paralysis he says has affected him since before the play-in tournament.

An Ontario man who took out a loan to pay for auto repairs said his car was repossessed after he missed two payments.
Ford’s electric vehicle unit reported that losses soared in the first quarter to US $1.3 billion, or US$132,000 for each of the 10,000 vehicles it sold in the first three months of the year.
Honda is set to build an electric vehicle battery plant next to its Alliston, Ont., assembly plant, which it is retooling to produce fully electric vehicles, all part of a $15-billion project that is expected to include up to $5 billion in public money.
As if a 4-0 Edmonton Oilers lead in Game 1 of their playoff series with the Los Angeles Kings wasn't good enough, what was announced at Rogers Place during the next TV timeout nearly blew the roof off the downtown arena.
Mounties in Nanaimo, B.C., say two late-night revellers are lucky their allegedly drunken antics weren't reported to police after security cameras captured the men trying to steal a heavy sign from a downtown business.
A property tax bill is perplexing a small townhouse community in Fergus, Ont.
When identical twin sisters Kim and Michelle Krezonoski were invited to compete against some of the world’s most elite female runners at last week’s Boston Marathon, they were in disbelief.
The giant stone statues guarding the Lions Gate Bridge have been dressed in custom Vancouver Canucks jerseys as the NHL playoffs get underway.
A local Oilers fan is hoping to see his team cut through the postseason, so he can cut his hair.
A family from Laval, Que. is looking for answers... and their father's body. He died on vacation in Cuba and authorities sent someone else's body back to Canada.
A former educational assistant is calling attention to the rising violence in Alberta's classrooms.
The federal government says its plan to increase taxes on capital gains is aimed at wealthy Canadians to achieve “tax fairness.”

J.T. Miller had a goal and assist and the Vancouver Canucks edged the Nashville Predators 2-1 to re-take the lead in their first-round playoff series.
The 36-year-old killed on Highway 5 this week has been identified as Juver Balmore, a husband and father of three young children who worked for CN Rail.
A fire that displaced three families from a townhouse complex in Surrey's Newton neighbourhood Friday afternoon is considered suspicious, local Mounties say.
More than 115 people who viewed the solar eclipse in Ontario earlier this month experienced eye damage after the event, according to eye doctors in the province.
A loud explosion was heard across Hamilton on Friday after a propane tank was accidentally destroyed and detonated at a local scrap metal yard, police say.
An 11-year-old boy struck by a transport truck in Etobicoke on Friday morning suffered critical injuries and is receiving treatment at a Toronto trauma centre, police say.

Calgary police took two people into custody on Friday after a stabbing in the community of Haysboro.
If you've spent any amount of time scrolling TikTok at 3 a.m. (it's OK -- we all have), you probably know the meme...
It will warm up tomorrow, but it will also be gusty at times.

Ontario Provincial Police are asking for the public's help in locating a missing man from Newfoundland who disappeared in eastern Ontario.
Breast cancer rates are rising in Canada among women in their 20s, 30s and 40s, according to research by the University of Ottawa (uOttawa).
Queen’s University says renowned Canadian broadcaster and alumna, Shelagh Rogers will serve as its 16th chancellor starting July 1.

The office of Quebec Housing Minister France-Élaine Duranceau prefers to openly ignore journalists' requests.
A pair of Montreal designers' work has now been viewed over 41 million times. Taylor Swift dons a Victorian throwback black gown in her latest music video, 'Fortnight', designed by UNTTLD due Simon Belanger and Jose Manuel Saint-Jacques.
Officials with Quebec's workplace safety board were sent to the Port of Montreal on Friday after a truck driver was killed on the job.

A cat that jumped from the balcony of a burning building in downtown Edmonton on Thursday afternoon will make a full recovery, building officials say.
A bill that would empower the Alberta government to remove elected municipal officials or strike down local bylaws is an "attack on local democracy," says the capital city's mayor.
As if a 4-0 Edmonton Oilers lead in Game 1 of their playoff series with the Los Angeles Kings wasn't good enough, what was announced at Rogers Place during the next TV timeout nearly blew the roof off the downtown arena.

A girl and a boy, both 14 years old, made their first appearance today in a Halifax courtroom, where they each face a second-degree murder charge in the stabbing death of a 16-year-old high school student.
Cape Breton Regional Police found a dead body in Sydney, N.S., Thursday evening.
A popular chef, who is fighting a battle against an aggressive form of cancer, is getting support from her community.

Parents in Gimli who rely on child care before and after school are sounding the alarm over policy changes coming in September.
Take an illustrated look back at the culinary history of Winnipeg.
Manitobans brought home an average of $2,200 less after taxes in 2022 compared to the previous year.

RCMP have identified 28-year-old Brianna Hayes from Oxbow, Sask. as the victim in an ongoing homicide investigation in the province’s southeast. As a result, police have charged 24-year-old Taylor Japp, also from Oxbow with second degree murder, an RCMP news release said.
Youth in Yorkton can now access a new Lego Therapy program in their community through SaskAbilities.
A Regina police officer was injured after another officer's gun was accidentally fired while conducting a search warrant early Friday morning.

More than a year has passed since the City of Kitchener announced it was pausing community consultations on the future of the Queen Victoria statue in Victoria Park, and there is still no timeline for a resumption of the process.
An investor with ties to apartment buildings across Ontario appears to be connected to 250 Frederick Street in Kitchener.
Ontario’s Minister of Economic Investment, Job Creation and Trade says a number of companies have shown interest in a tract of land the Region of Waterloo is trying to assemble in Wilmot Township.

Over six months after Saskatchewan's government announced a significant $90 million investment in social services, the initiative is reportedly making progress.
The Saskatoon Police Service (SPS) and Saskatchewan Coroners Service are investigating after a woman’s body was found at a recycling facility Friday morning.
Four people, including two teen girls, were arrested and charged after an attempted armed robbery on Thursday evening.

Two hunters from North Bay, Ont., and a third from Temagami pled guilty recently to offences they committed during a 2022 moose hunt.
Sophie Gregoire Trudeau says there is 'still so much love' between her and Prime Minister Justin Trudeau, as they navigate their post-separation relationship co-parenting their three children.
Ontario Provincial Police responding to a disturbance in West Nipissing this week discovered a conscious person lying in the street.
Police said they were called to a weapons-related incident on Morning Glory Drive around 1:30 p.m. Friday.
Three months after the launch of curbside green bin collection for homeowners, a pilot project will analyze expanding the program to include medium to high-density apartments and condominiums.
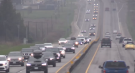
A fatal crash in Thames Centre closed down a portion of Highway 401 westbound. Around 2:15 a.m., first responders were called to westbound lanes of the highway between Culloden and Putnam Roads for a two-vehicle crash.
One person killed in multi-vehicle crash in Innisfil on Friday.
With its Innisfil location’s lease set to expire within the next five years, Gateway Casinos is eyeing a plan to move.
The Ontario Provincial Police (OPP) says it's investigating an interaction between a uniformed officer and anti-Trudeau government protestors after a video circulated on social media.

All the excitement of the NFL Draft has officially descended upon Detroit, with Windsor welcoming the spillover.
A ribbon cutting to celebrate the opening of a new grief support centre on Baseline Road in Windsor marked a bittersweet moment for many at Julien’s House Friday morning.
Windsor police have arrested two people after seizing $120,000 in illegal drugs.

The B.C. NDP has asked the federal government to recriminalize public drug use, marking a major shift in the province's approach to addressing the deadly overdose crisis.
Saanich council will be discussing a report Monday prepared by Saanich Fire Chief Michael Kaye on the merits of amalgamating the fire departments of Victoria, Oak Bay, Esquimalt and Saanich.
When Art Kinarthy embarked upon this quest, he never could have imagined where it would ultimately lead.

An emaciated dachshund is now recovering thanks to a Good Samaritan who found the pup near a biking trail in Kelowna, according to the BC SPCA.
Search and rescue crews have been called in after a vehicle belonging to a missing senior was located near a rural intersection outside of Kelowna Tuesday.
Major crime detectives in British Columbia are investigating a suspected homicide after a body was found in a remote area southeast Kelowna over the weekend.

An Alberta political scientist said the NDP leadership hopefuls remained fairly even following the first of the party’s debates.
It was a busy Wednesday evening for fire crews in Lethbridge County after multiple grass fires were sparked near the Kipp rail yard.
A former University of Lethbridge student has been awarded the Medal for Diversity, Equity, Inclusion and Equity by NASA.

The City of Sault Ste. Marie is looking for community input on some design concepts for the waterfront.
Meeting next week, city council in Sault Ste. Marie will get an overview of what to expect if it decides to implement a new tax on empty homes in the city.
Two hunters from North Bay, Ont., and a third from Temagami pled guilty recently to offences they committed during a 2022 moose hunt.

Legendary sportscaster Bob Cole was a Newfoundlander through and through, and his daughter says his connection to the province was 'everything' to him.
Cenovus Energy has been ordered to pay a $2.5-million fine for its role in the largest offshore oil spill ever recorded in Newfoundland and Labrador.
As more Canadians find themselves struggling to afford or find housing, the country's smallest province is the only one that can point to legislation recognizing housing as a human right.
The Shopping Trends team is independent of the journalists at CTV News. We may earn a commission when you use our links to shop. Read about us.