TORONTO -- This is part two of a three-part series by Environics Analytics Senior Vice President and Practice Leader Rupen Seoni, who takes a deeper look into how the COVID-19 crisis is impacting the Canadian population financially and socially though a segmented system called PRIZM. Today, PRIZM’s five-year rebuild launches, capturing new insights about Canadians from coast to coast.
After weeks of stay-home advisories, physical distancing, business closures and terrible weather in much of the country, the first long weekend of the summer season was upon us. As Canadians everywhere yearned for better weather and some semblance of normalcy, health officials expressed concern about a spike in COVID-19 cases and cottage communities worried about seasonal residents bringing illness with them.
And some business owners cautiously began opening their doors again, albeit under many restrictions. So how much did Canadians actually get out and about?
What we measured
To find out, Environics Analytics (EA) turned to a privacy-compliant database called MobileScapes, which was developed from aggregated mobile phone movement data from multiple sources. Using these data, we identified devices—that is, people carrying mobile devices—that were “out and about” during the daytime on Saturday and Sunday May 16-17.
The Out-and-About Rate tallied devices that were observed more than 100 metres from their inferred home postal code at least three times for at least ten minutes each in a day. This analysis was focused on Montreal, Toronto, Calgary and Vancouver census metropolitan areas.
We analyzed the results through the lens of our new PRIZM segmentation system that has been rebuilt from scratch to reflect important changes in Canadian society since the last PRIZM was released five years ago.
PRIZM assigns every Canadian postal code to one of 67 lifestyle segments based on demographics, socioeconomic status, diversity and psychographics. This analysis helps identify which populations tend to go out and which are more likely to stay home. Understanding how different populations behave helps health officials respond with more targeted programs and communications.
In addition the analysis gives governments and financial services more current data to monitor how the economy is recovering in different communities and for different populations. Retailers also benefit from information on activity levels to decide which locations to open first and how to modify products and services by monitoring who is returning to the marketplace and who is staying home.
What about privacy?
The information in EA’s MobileScapes database is sourced from third-party commercial vendors who aggregate location data. This means that their data are collected from apps within which users have provided consent for their locations to be captured and used. No personally identifiable information is collected.
To further protect the privacy of individuals, data points are geographically “jittered”— randomly moved a small distance—before being provided to Environics Analytics and are aggregated to postal codes. Other data used in this analysis include EA’s proprietary databases, modelled to postal codes and based on publicly and commercially available sources with no personally identifiable information used. In sum, this analysis was developed using privacy-friendly data.
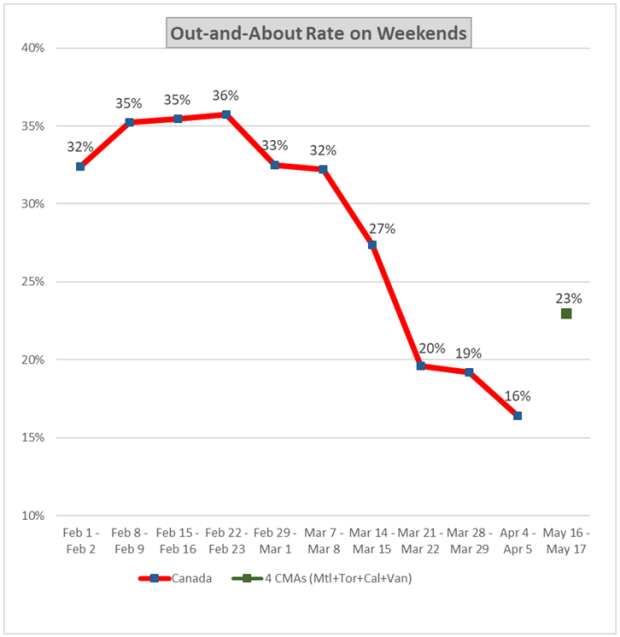
The overall out-and-about trend
The chart below shows the weekend-by-weekend national Out-and-About Rate from early February to Easter weekend (April 4-5). The full analysis of national and regional data for this period can be found in our previous report. The rate for the May 16-17 weekend is also shown.
While not exactly comparable, the two portraits likely indicate a substantial increase in Canadians’ Out-and-About Rate in May’s long weekend compared to April’s Easter weekend. We conclude this because the most recent measure is for large metros which have generally had lower Out-and-About Rates compared to the country overall.
Who is going out and about?
In the big picture, understanding who is out and about and likely returning to the brick-and-mortar marketplace helps us understand how to adapt—and who to communicate with—in a volatile environment. While this analysis is limited to the four largest metros, some important patterns emerge with implications for fully opening the economy.
The table below presents a sample of PRIZM segments and their Out-and-About Rates to illustrate these patterns.
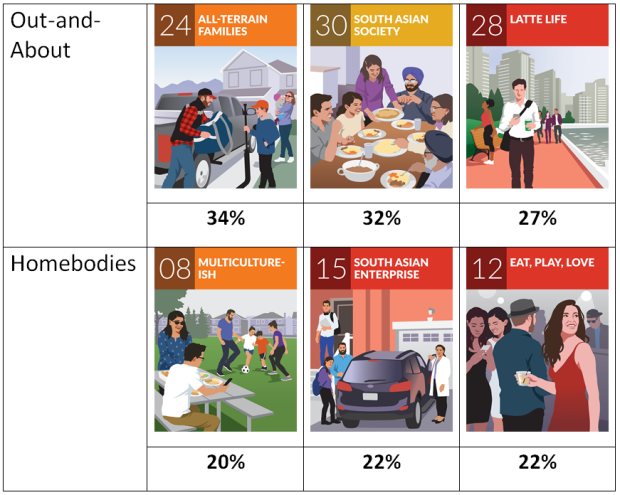
1. Both Out-and-Abouters and Homebodies represent many different kinds of lifestyles. Communicating with both groups requires understanding who you’re trying to reach and what resonates with them.
Families in the suburbs, families in the city, young singles and older couples—all can be Out-and-Abouters or Homebodies depending on their lifestyles. If you are trying to reach Out-and-Abouters, the three segments 24 All-Terrain Families, 30 South Asian Society and 28 Latte Life would have very different needs and would require different communication strategies. This is also true for the Homebodies segments.
2. Socioeconomic status and education appear inversely related to Out-and-About Rates.
We’ve contrasted the PRIZM segments in the top row of the table above with those in the bottom row in pairs to illustrate this inverse relationship. The numbers associated with PRIZM segments reflect their socioeconomic ranking, with 01 being the highest and 67 the lowest. The ranking is a combination of household income, employment type and education.
Regardless of type of population, the probability of being out and about increases as you go down in socioeconomic status. Household incomes in 08 Multiculture-ish average over $20,000 more than in 24 All-Terrain Families, and Multiculture-ish members also have higher education levels. Both segments consist of families with school-age children living in the suburbs. But All-Terrain Families members had much higher Out-and-About Rates during the long weekend.
The two predominantly South Asian segments in the table above both contain large, urban families and are typically found nearby each another in Toronto and Vancouver. But household income in 30 South Asian Society is $20,000 less than in 15 South Asian Enterprise. Members of South Asian Society tend to have lower education levels and residents are more likely to work in blue-collar jobs. They are also out and about much more than members of South Asian Enterprise.
The two young segments in the table show similar patterns. There is nearly a $30,000 difference in household income and a meaningful difference in Out-and-About Rates. Members of 12 Eat, Play, Love are more affluent than members of 28 Latte Life even though many of the two groups’ behaviours and preferences are similar.
Who will be first in line to get a haircut? A prediction
While most of us are concerned about complying with preventive guidelines in the face of the COVID-19 pandemic, nearly ten weeks into business closures many Canadians are keen to do something decidedly non-essential: get a haircut. We decided to put PRIZM, our SocialValues psychographic indicators and MobileScapes to work to try to predict which population segments will be first in line when hair salons open and which will be conflicted. Here is how we broke it down:
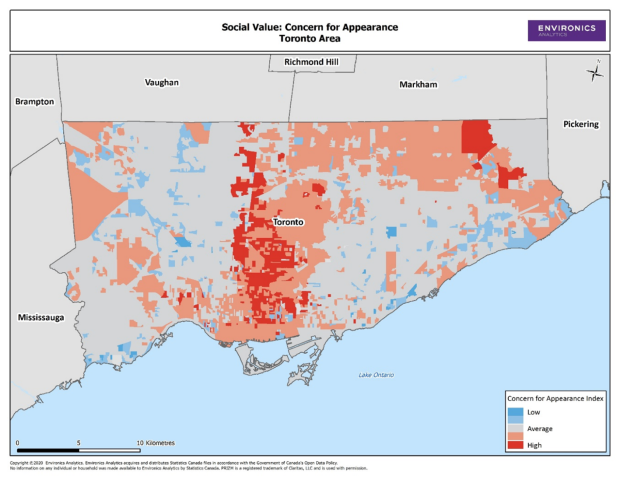
First, we assume that people in PRIZM segments with high scores for the social value Concern for Appearance will be most eager to get their hair cut. The map below shows locations in the City of Toronto with high concentrations of this population. Compared to national averages, Toronto tends to score average to well above average on Concern for Appearance. There are relatively few below-average areas on the map.
(Advice to non-Torontonians: bite your tongues!) The dark red areas (well above average) tend to be relatively affluent neighbourhoods, with many of the lighter red ones (above average) containing either younger singles and couples (near downtown) or culturally diverse families (to the north and east).
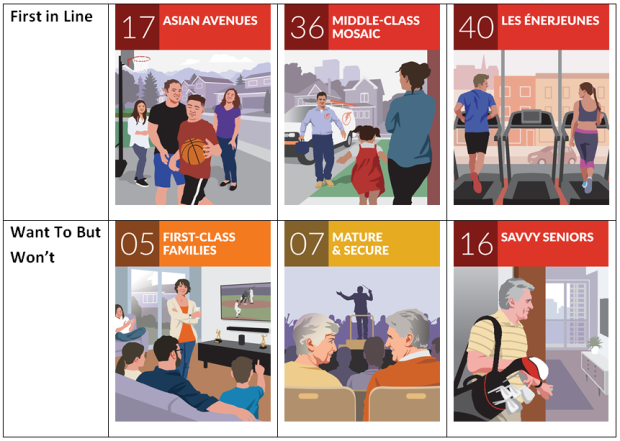
But some of the PRIZM segments with high Concern for Appearance also score high on a social value called Effort for Health, which that could counter their desire to get that haircut for fear of COVID-19 exposure. We also took into account the segments’ Out-and-About Rates over the last long weekend as an indicator of their willingness to leave their home area. We’ve organized our predictions into two groups:
1) First in Line (high Concern for Appearance, low Effort for Health, above-average Out-and-About Rates)
2) Want To But Won’t (high Concern for Appearance, high Effort for Health, average to below-average Out-and-About Rates)
PRIZM haircut predictions
While the haircut example is tongue-in-cheek, it does illustrate the need to draw on a combination of data sources—both data with timely insights and those with great depth—to support effective decision-making and outreach in a rapidly evolving crisis.