This is the first in a series of blogs leading up to the provincial election that will look at voter segments their party preferences and key ridings.
Who votes? It’s a question that comes up every election—and it’s an important one.
In the last election, the average voter turnout (share of voters on the voters’ list who cast a ballot) was barely over 50 per cent.
That’s down considerably over the past 40 years when about two-thirds of voters cast a ballot. But aside from highlighting a significant drop in voter turnout, that stat alone doesn’t tell us much.
Conventional wisdom suggests older voters are most likely to turn up at the ballot box than younger people.
But do the numbers bear this out? Is this true of all voters or does it vary depending on where they live and what they believe? Are there other important differences that can be used to help predict voter behaviour at the ballot box?
The work we do here at Environics Analytics can help answer those questions. By cross-referencing the returns from the last provincial election in 2014 with our PRIZM segmentation system, which divides Canadian households in to one of 68 lifestyle types, we get a rich, nuanced picture of voting tendencies by small segments of society.
And before you ask, this approach respects everyone’s privacy because we don’t use any individual data. In fact, there is no way we could since voting data is anonymous.
So who votes?
Suburban cultural enclaves have low turnout. This is a pattern that may come as a surprise.
The ridings with some of the lowest turnout in the province using the 2014 data mapped onto 2018 riding boundaries are:
- Brampton West (39.6%)
- Mississauga-Malton (40.1%)
- Humber River-Black Creek (42.2%)
- Mississauga Centre (42.9%)
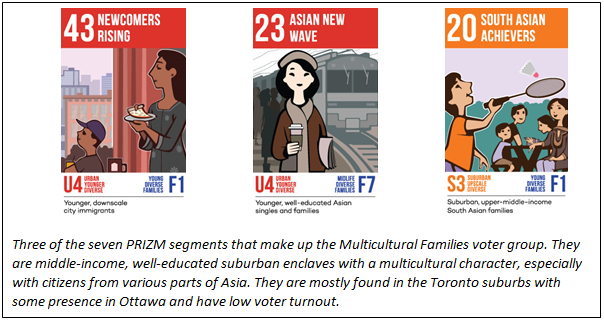
Some of the groups driving this low turnout are from segments we describe as Newcomers Rising, Asian New Wave and South Asian Achievers. Generally these segments are comprised of middle-income, educated populations.
Given the growing cultural diversity of our country, engaging these voters in elections is critical to ensuring that government more fully represents the interests of its citizens.
One of the things PRIZM allows us to do is examine the most prominent social values within each segment (we track 95 distinct traits). With respect to these segments we see social values that signify a strong Importance of Status, which reflects belief in traditional family structures.
They also show strong support for Multiculturalism, among many other insightful characteristics that could imply the need for changes in how we’ve traditionally encouraged participation in the electoral process—and for the political parties to influence which way they vote.
Moving turnout by a few points with these voters could change the winning party in several ridings—and possibly the election—if the candidates and parties are able to focus their efforts on the right issues and mobilizing the vote.
Wealthier segments vote more than poorer ones. To assess this we turned to our PRIZM segmentation system again, but this time we bundled our 68 segments in to seven groups based on shared similarities between their demographics, their turnout at elections and party preference.
It’s important to note that each of these groups had a wide distribution of household incomes. Within every voter group, the more affluent PRIZM segments have the best voter turnout. Based on these findings we might surmise that the wealthy feel they have enough of a stake in the outcome of elections to get out and participate. Or conversely, the less wealthy are less likely to feel that voting is essential to looking after their interests.
Younger segments vote less than older ones. It appears conventional wisdom is accurate here.
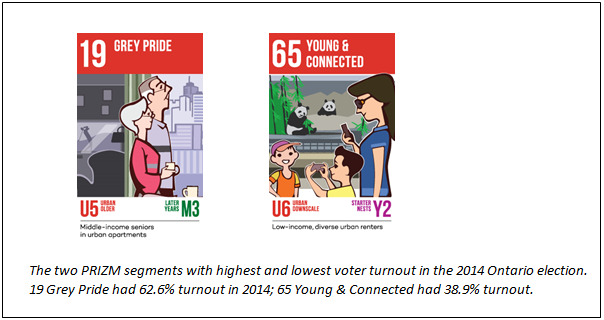
For example, the segment we call Grey Pride had the highest turnout at 62.6%.
The poorest turnout was a low-income, young segment called Young & Connected, with just 38.9% casting a ballot in 2014.
Clearly there is a generational difference in the perceived value of voting in elections. What’s interesting is that the younger segments have a strong belief in Active Government, but also have strong Rejection of Authority and weak sense of Duty.
So they would need to be convinced (not in a top-down, authoritarian way, of course) of the value of voting and shown how effective government services need participation in the electoral process. They’d probably respond less well than older citizens to a message telling them they should vote because it’s a responsibility of being in a democratic society.
So what do we think of the “older people vote and younger people don’t” wisdom?
It has truth to it, but what’s clear is that voting dynamics are multifactorial so it’s important to understand how a confluence of factors influences behaviours on smaller segments of society, to be targeted and effective in influencing their behaviours.
In the next blog, we’ll discuss more about the voter segments I mentioned earlier and their party preferences. This will help narrow down who to watch closely on election night.
What PRIZM5 segment do you belong to? http://www.environicsanalytics.ca/PRIZM5
Rupen Seoni is Senior Vice President and Practice Leader at Environics Analytics. He provided commentary on voter segments and demographics in CTV’s federal election coverage and will be part of CTV’s provincial election night coverage on June 7. This is the first in a series of blogs leading up to the provincial election that will look at voter segments their party preferences and key ridings.