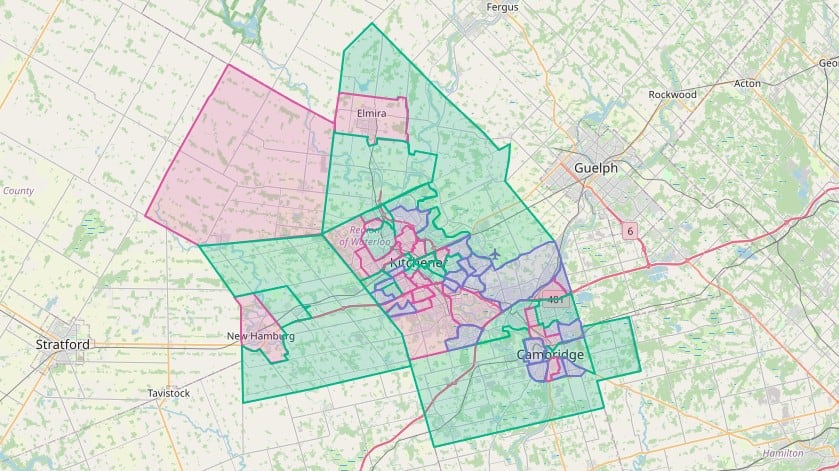
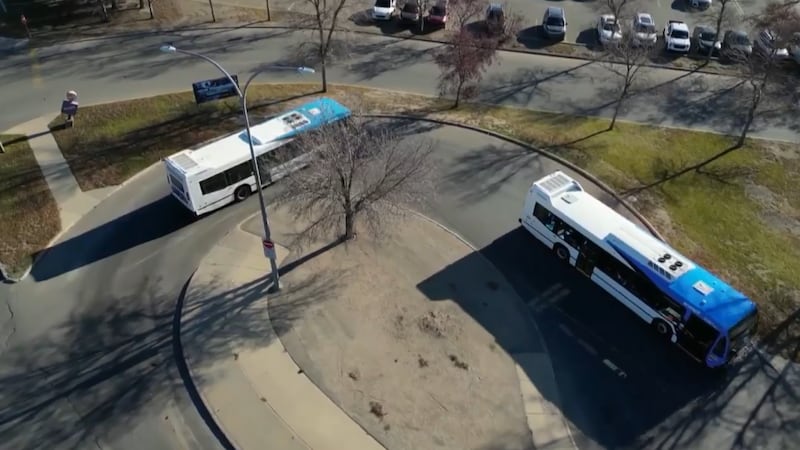
A new interactive map aims to show how access to key services varies across neighbourhoods in Waterloo Region. One Million Neighbours Waterloo Region (WR) announced the launch of the first version of its Neighbourhood Service Map which ranks neighbourhoods based on access to services including public transit, green space, schools, health care, libraries and community spaces. According to the group, neighbourhoods are categorized as having “most access,” “average access” or “least access.” The rankings also account for population size, meaning areas that have experienced rapid growth without matching investments in services may receive lower scores. “As Waterloo Region grows to 1,000,000 people in the coming decades, we need to know that we are allocating resources equitably and that we are building a region where people in every neighbourhood can thrive,” a media release read in part. The project was developed in collaboration with Civic Tech WR, a volunteer group of software and data professionals. One Million Neighbours Waterloo WR said initial findings from the map suggest differences both between and within cities. “While generally, Kitchener and Waterloo are better-served than Cambridge, there are pockets in all three cities ranked “least access” for different reasons," the release read. “Rural neighbourhoods fare very well in the overall ranking, due to their abundance of green space, community spaces, and even libraries relative to their population. However, they have low access to healthcare and transit services.” The group said the map also indicates that some high-density areas, such as the university district and uptown Waterloo, rank “average” for transit access which they said suggests that population growth is outpacing current transit service levels. The group said the map is designed to be used by the community to better understand service access at a local level. “We recognize that keeping this map relevant and up-to-date in an ongoing responsibility. One Million Neighbours intends to refresh the data at least annually, in partnership with our volunteer researchers, local Universities and Civic Tech WR,” the release read. Some of the data is drawn from Open Street Map, and the group said it is exploring ways to contribute additional locally sourced data through community mapping initiatives. “We also plan to add new datasets to meet the needs of neighbourhood associations, nonprofits, and community groups in their advocacy and planning efforts.” The map will be released on Monday.