How is the U.S. adapting to climate change?
The widespread effects of climate change can already be felt, from rising sea levels to extreme weather events.
The map below shows how local and regional governments in the United States are trying to adapt to a changing environment.
All information and text taken from the U.S. National Climate Assessment report.
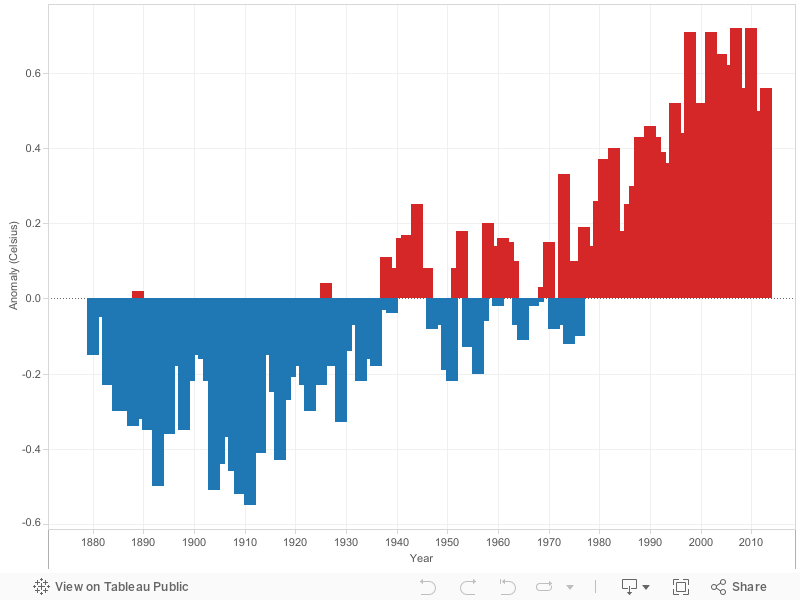
Global Land and Ocean Temperature Anomalies
The below chart tracks global temperature anomalies between the months of January to April from the year 1880 through to 2013. Anomalies are with respect to the 20th century average.
The trend from shows a rise of 0.68 Celsius per Century.
Data is taken from the National Climatic Data Center