

Environics Analytics Senior Vice President Rupen Seoni with a first in a series -- Deciding Votes 2019 -- on the upcoming election.
TORONTO -- The 2015 federal election had a significant increase in voter turnout overall with 68.3 percent of registered voters casting a ballot. This was 7.2 percentage points higher than in 2011 and the highest turnout in more than 20 years.
Much has been written about a young, media-savvy Justin Trudeau running an optimistic campaign. His campaign was combined with a desire for change among voters that inspired not only shifting allegiances in favour of the Liberal Party, but also previously disengaged voters to cast a ballot.
Many factors drive the results we see in a riding race: voter turnout, party platforms, issues in play, desire for change, quality of local candidates and, of course, the party leaders themselves. If we focus on voter turnout, the question for this election is whether those who turned out in larger-than-usual numbers in 2015 will show up at the polls again in this election.
When we look at voter turnout through the lens of Environics Analytics’ PRIZM lifestyle segments, a clear profile emerges. (You can find out your PRIZM lifestyle segment by entering your six-digit postal code in our PRIZM Lookup tool.)
Who is more (and less) likely to vote?
There is a commonly held belief that young people are less likely to vote than older Canadians. While this is true, in part, there are other dynamics at play. PRIZM helps us understand this more easily. We can’t show all 68 lifestyle segments here, but we will highlight a few to illustrate some of the critical dynamics. Note that the number of the segment indicates socioeconomic status indicator rank (01 being highest, 68 being lowest).
The colours represent categories of urbanity (from urban to rural). Each segment also provides codes to indicate the Social Group, which reflects a combination of socioeconomic status, language/diversity and urbanity (bottom left of the icons) and Lifestage (bottom right).
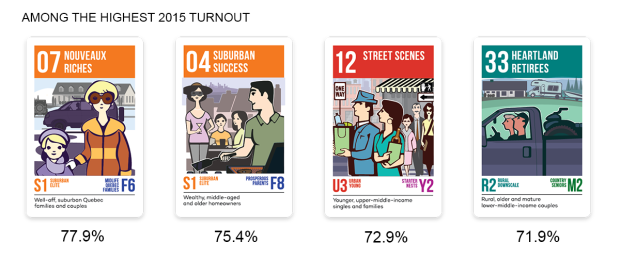
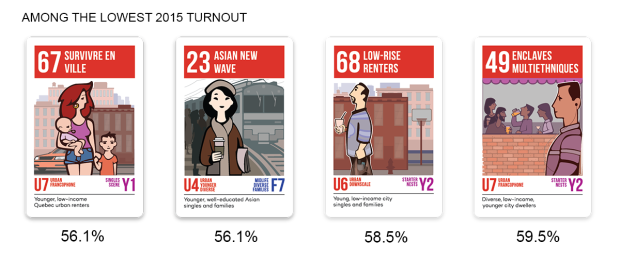
Some observations from the 2015 voter segmentation:
- Older citizens are more likely to vote
- More educated, affluent citizens are more likely to vote; conversely, lower-income and less-educated citizens are less inclined to vote
- Citizens living in multicultural neighbourhoods (especially those with large concentrations of East Asian heritage) are less likely to vote
Although younger Canadians overall are less likely to turn up at the polls, not all young segments are disinclined to cast a ballot. Some of the more affluent, educated PRIZM groups are in the top tier of voter turnout. Efforts to engage younger Canadians should focus on those without university educations who are lower down on the socioeconomic scale.
Similarly, when it comes to engaging newcomers and second-generation Canadians, the parties have some work to do. Only three of 16 PRIZM segments with a “high” cultural diversity index rank above-average for voter turnout and they are all well-off segments. Many of the remaining segments fall near the bottom of the list. The engagement challenge, therefore, needs focus.
Increased turnout from 2011 to 2015
As noted, voter turnout jumped by over seven percentage points in the last federal election. PRIZM analysis helps us understand the patterns of voter segments that disproportionately turned out in bigger numbers, compared to ones that had much more modest increases.
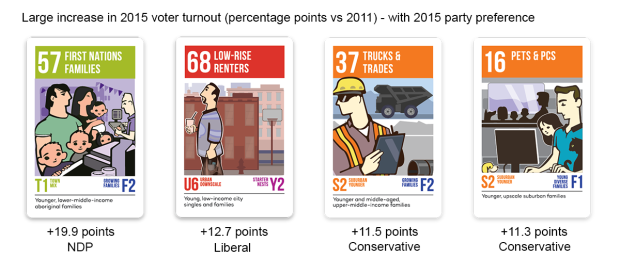
The last election motivated many younger voters to cast a ballot compared to the previous election in 2011. The increased turnout came from a range of segments of society: First Nations voters, struggling urbanites, middle to lower-middle-income blue-collar voters, and the middle-class multi-ethnic suburbs found around Canada’s larger cities. They are also more likely to be found in Western Canada and Ontario.
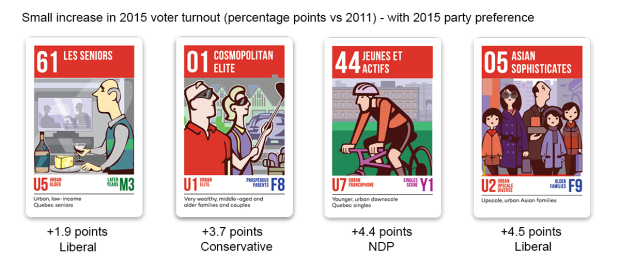
Many of the predominantly Francophone PRIZM segments did not have the significant increases in turnout that their Anglo counterparts did. Affluent, older PRIZM segments also had relatively small increases in turnout (but they already tend to turn out in bigger numbers).
Where could turnout matter most in 2019?
Let’s focus on specific riding races that meet both criteria below where turnout could make the difference between re-election and an upset for the incumbent because a shift in who turns out to vote could affect which party wins:
- Ridings where turnout jumped more than average in 2015, and
- Close races (won by <5 percent)
We’ve grouped the ridings below, giving a general description to the PRIZM voter segments whose turnout (or lack thereof) could affect the outcome on October 21 given how close these races were in 2015. Below we show the winning party in 2015 and percentage point margin over the second-place party. Turnout increases refer to riding-level turnout in 2015 compared to 2011, also in percentage-point gain.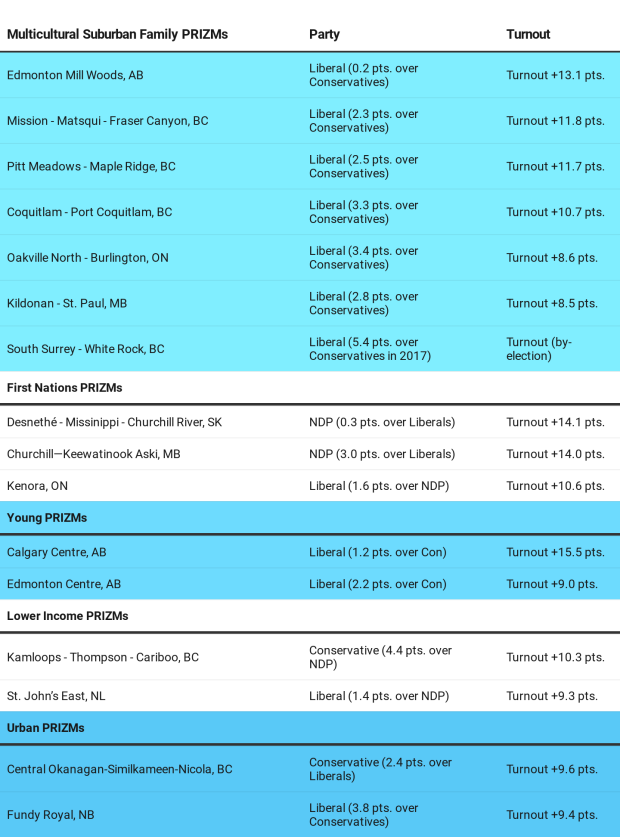
Map showing change in voter turnout by riding and which party won the riding
Click to view full-screen version of map
Rupen Seoni leads an industry practice area that includes the public sector, health care, energy and not-for-profits. Rupen appears regularly on CTV’s Canadian and U.S. federal election coverage as a commentator on voter demographics in key races.
About Environics Analytics
Environics Analytics is the premier marketing and analytical services company in North America. The company offers a full range of analytical services to help customers turn data and analytics into insight, strategy and results. Environics Analytics' team of quantitative marketers, modellers and geographers are experts at helping organizations identify their business challenges, develop data-driven solutions and achieve success along every phase of their analytics journey. To learn more about Environics Analytics, visit environicsanalytics.com.


