
A quarter-century of cancer data is now available in a report jointly released by the Canadian Cancer Society, Statistics Canada and the Public Health Agency of Canada on Tuesday.
The Canadian Cancer Statistics 2022 special report on cancer prevalence sheds light on the most common forms of cancer over the 25 years between 1994 and 2018, as well as the populations most likely to be diagnosed.
As the number of people living with cancer, or living post-cancer, in Canada rises, so will the demand for cancer support and care.
The report aims to help identify gaps in health care and cancer care, and offer some clues as to how resources can be allocated to fill those gaps, according to Jeff Latimer, director general of health statistics with Statistics Canada.
“Timely and accurate data on cancer prevalence in Canada is critical to understanding the disease’s toll on society and our healthcare system," Latimer said in a media release issued on Tuesday.
"Data are invaluable in assessing cancer outcomes, measuring how far we’ve come, and identifying areas for improvement.”
CTVNews.ca explores some key findings from the report below.
All of the following rates are per 100,000 people, over a period of 25 years, unless noted otherwise. The report did not include data for Quebec.
PREVALENCE BY TYPE
According to the report, cancer in reproductive organs and colorectal cancer are most prevalent across Canada, by a wide margin.
From 1994 to 2018, breast cancer accounted for 19.4 per cent of all diagnoses, while prostate cancer accounted for 17.8 per cent and colorectal cancer accounted for 11.3 per cent.
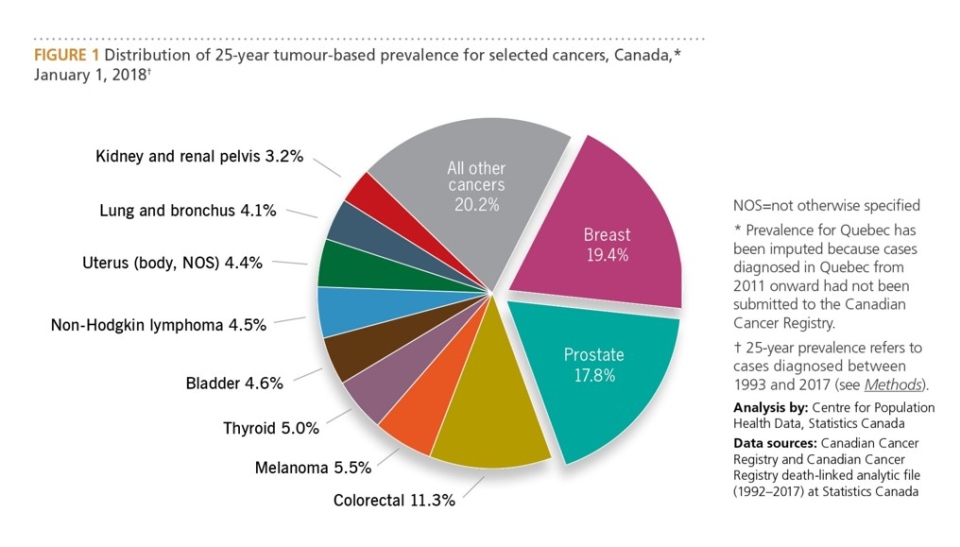 Melanoma accounted for 5.5 per cent of diagnoses, thyroid cancer accounted for 5 per cent, bladder cancer for 4.6 per cent, non-hodgkin lymphoma for 4.5 per cent, uterine cancer for 4.4 per cent, lung and bronchus cancers for 4.1 per cent, kidney and renal pelvis cancer for 3.2 per cent and all other cancers for 20.2 per cent.
PREVALENCE BY DURATION
According to the study, most people – 60.9 per cent – who had cancer or were living post-cancer were five to 25 years out from their diagnosis. This duration accounted for the majority of people who had been diagnosed with breast, prostate and colorectal cancer.
A further 20.7 per cent were between two and five years out, and 18.4 per cent were zero to two years out.
Among people with lung and bronchus cancers, 37.5 per cent were between zero and two years out from diagnosis, 37.1 per cent were between five and 25 years out and 25.4 per cent were between two and five years out.
According to the report, the first couple of years after diagnosis are when patients are most likely to be receiving primary cancer treatment or recovering from its effects.
"The third to fifth year after diagnosis is a period that typically requires close clinical follow-up for recurrence or another primary cancer, as well as supportive care," the report states.
"People alive more than five years after a cancer diagnosis have likely completed their treatment, but some may still need clinical monitoring and supportive care."
RURAL-URBAN PREVALENCE
Over study periods of two and five years, all cancers were generally more prevalent in rural settings compared to urban settings.
This was the case in all provinces and territories, except Nunavut where the entire population was considered rural, and Manitoba, where prevalence was about equal.
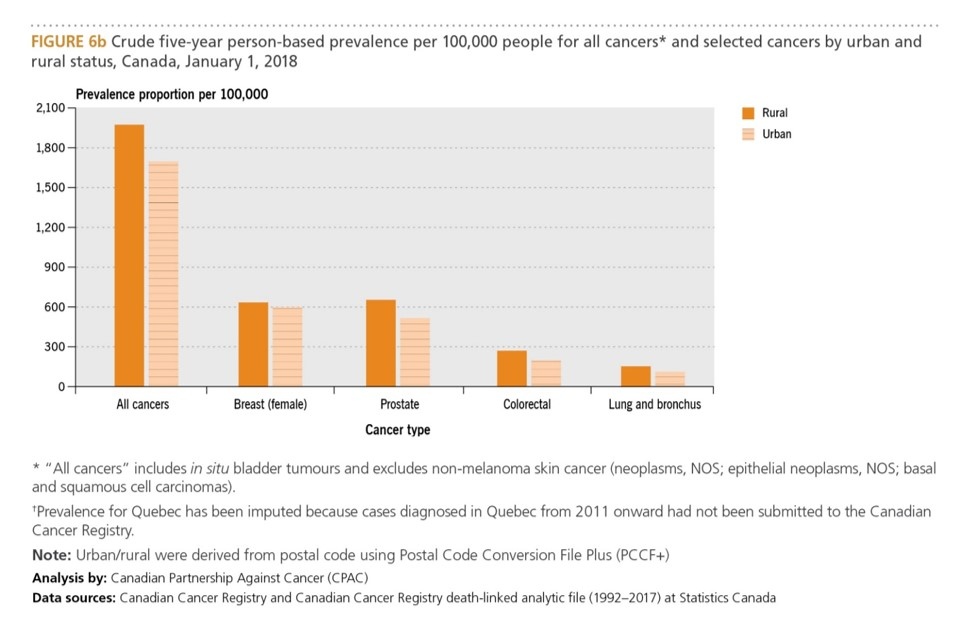 One factor driving this urban-rural divide is likely age, the report states, since Canadians living in rural areas are typically older than those living in urban areas and cancer diagnosis rates are higher in seniors.
The report said established cancer risk factors "such as smoking, alcohol consumption and obesity" are also more common among people living in rural areas, compared to those in urban areas.
PREVALENCE BY PROVINCE
Between 1994 and 2018, cancer rates were highest in the eastern provinces and Ontario, and generally lower in the central and western provinces.
Specifically, the prevalence of cancer was highest in Newfoundland and Labrador, followed by New Brunswick, Nova Scotia, P.E.I., Ontario, British Columbia, Manitoba, Saskatchewan, Alberta, Yukon, Northwest Territories and Nunavut, in that order. Quebec was not included.
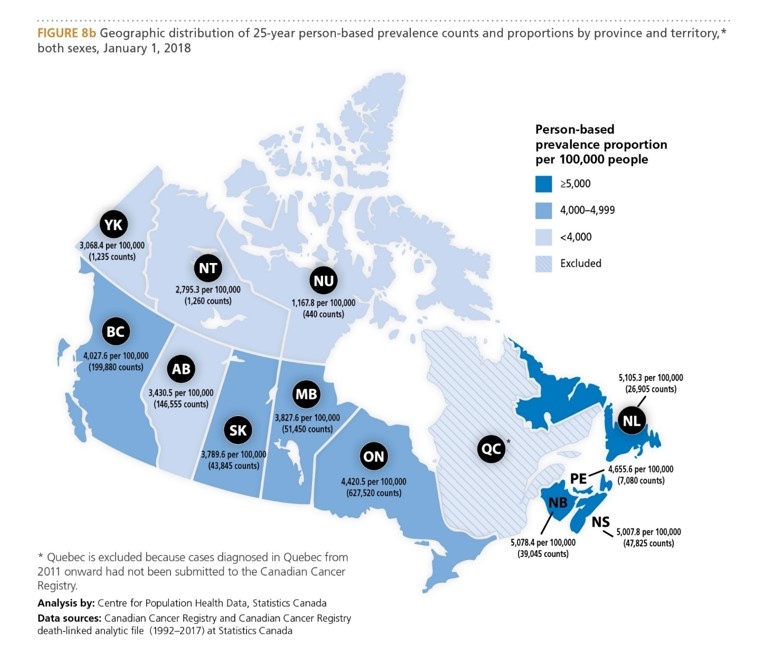 As with rates in urban and rural settings, the authors said differences in age distribution, risk factors and diagnostics influence the rates in each province.
PREVALENCE OVER TIME
The study found national cancer rates per 100,000 people rose gradually over 25 years, from 1994 to 2018. However, the authors attribute the increase to an aging population, as well as better cancer screening and treatments, which both increase the odds of survival across certain cancer types.
The report did not look at environmental factors that might contribute to cancer rates and outcomes, such as exposure to known carcinogens, and said the national data needed to better understand those factors in Canada are "limited or lacking."
"Together the cancer control community is working to address these important data and knowledge gaps so that we can better identify disparities in outcomes that require increased attention and investment," the report concludes.


