CTVNews.ca highlights some key facts and figures showing the devastating impact of the wildfire ravaging Fort McMurray and the surrounding area, as well as a few charts which put the fires in historical perspective using wildfire data from the Alberta government.
80,000+: number of people displaced in northern Alberta
101,000: size of the fire in hectares as of Friday, May 6
Below, Calgary-based journalist Bryan Passifiume puts that size in perspective, showing what 85,000 hectares looks like when overlaid over maps of New York City and Toronto.
Click here if you're reading this in an app
Toronto:
More perspective? Here's the current size of #ymmfire overlaid over #yyz - 85,000 hectares is a huge area pic.twitter.com/rOd4jVZL4N
— Bryan Passifiume (@BryanPassifiume) May 5, 2016
NYC:
More perspective, you say? Here's the 85,000 ha #ymmfire on NYC - covers all Manhattan, most of Brooklyn pic.twitter.com/lNJochrhgX
— Bryan Passifiume (@BryanPassifiume) May 5, 2016
1,600: number of structures destroyed in Fort McMurray and the surrounding area (as of Wednesday afternoon; no updated figure yet available)
49: Total number of fires burning in the region as of Thursday.
More coverage:
Historical Data
The number of hectares burned so far has already eclipsed, by far, the total number of hectares burned by forest fires in Alberta in 2013 and 2014 put together.
The chart below shows how many hectares were burned in the province from 2005 to 2014 (2015 numbers are not yet available). And it also shows how devastating the Slave Lake fire was in 2011 when conditions in the province were especially windy and dry.
Source: Government of Alberta
While authorities have not yet confirmed what started the fire, it’s believed it was human-caused due to the lack of lightning in the area.
The chart below shows data from 2005 to 2014 highlighting the fact that humans cause more fires per year than lightning.
Source: Government of Alberta
The chart below shows the number of wildfires in the Alberta by year, between 2005 and 2014.
Source: Government of Alberta
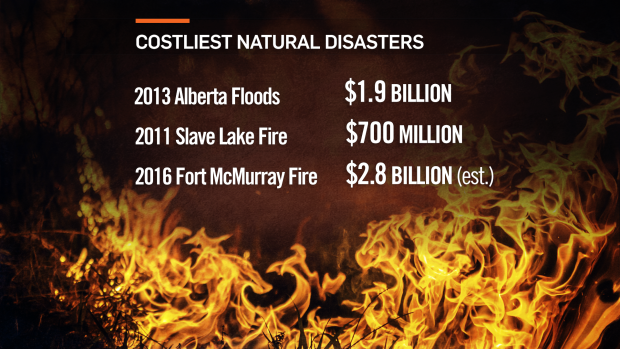
COST
$9 billion: estimated cost by the Bank of Montreal of insurable damage caused by the Fort McMurray wildfire.
The province has seen devastating disasters in the past five years. Some of Alberta’s costliest dating back to the Slave Lake fire: