CTVNews.ca has put together this interactive and comprehensive explainer for some of Canada's key economic indicators.
Jump to:
GDP
A country's gross domestic product is one of the key indicators of a country's economic health, and is generally seen as the size of a country's economy.
It's given as a dollar value – usually in the hundreds of billions or trillions – and represents the total value of all goods and services produced over a year.
According to Statistics Canada, "An increase in real GDP is interpreted as a sign that the economy is doing well, while a decrease indicates that the economy is not working at its full capacity."
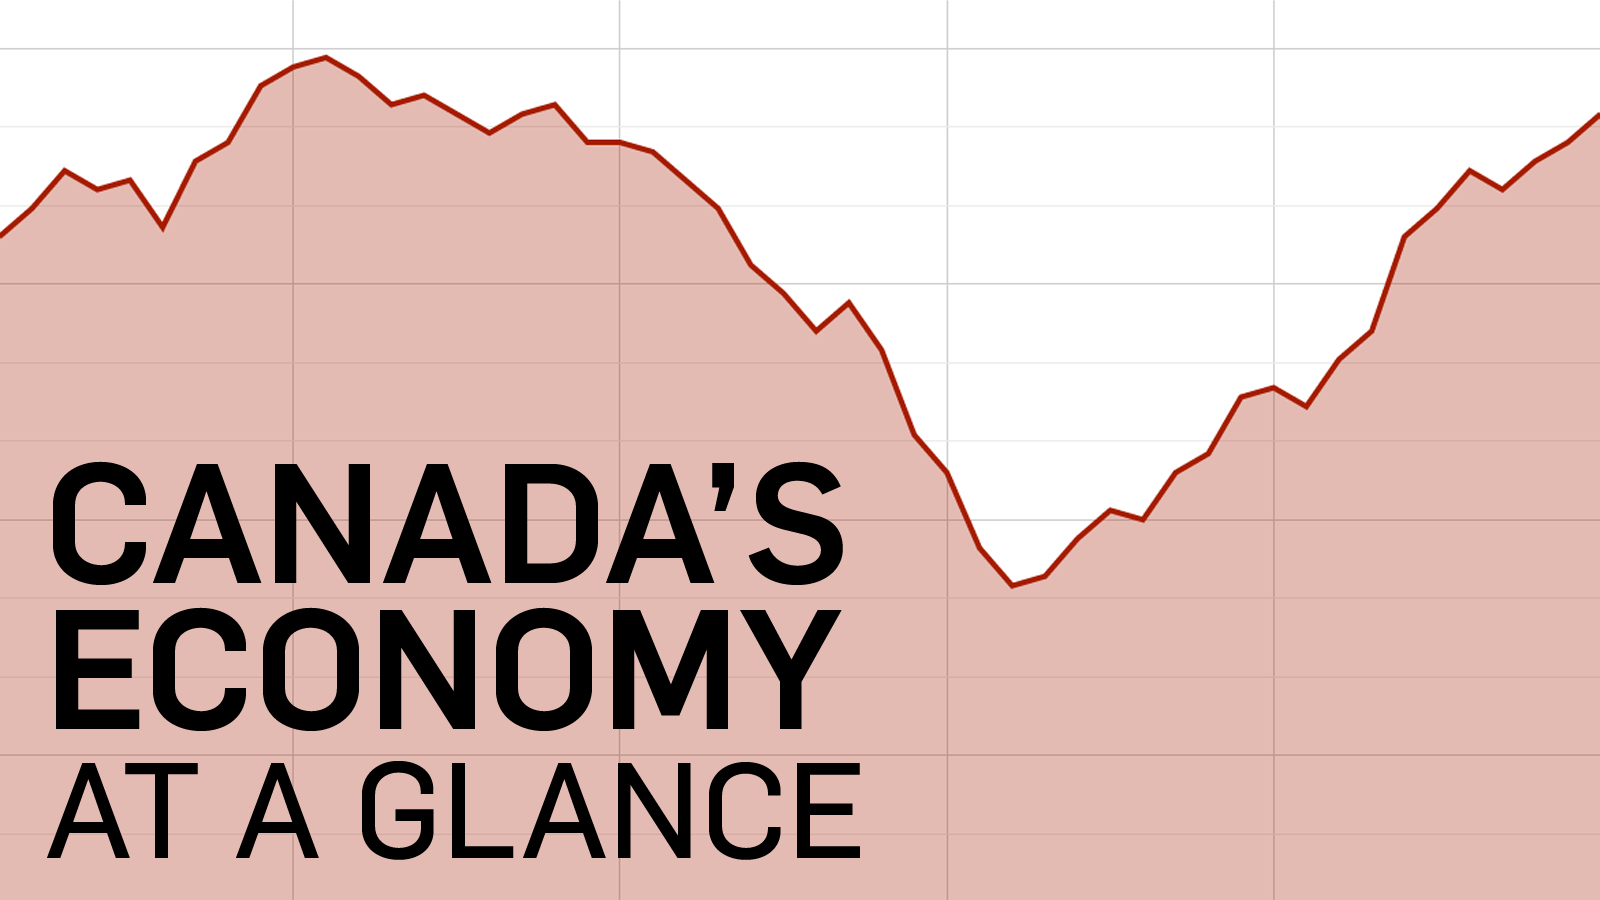
Canada's GDP has climbed steadily over the past decade, rising from just under $1.4 trillion in January of 2005 to more than $1.6 trillion in the fall of 2014 (values, from Statistics Canada, is given in 2007 dollars).
The steep decline near the end of 2008 is explained by what the International Monetary Fund called the greatest recession since the Second World War. In Canada, the recession lasted from the fall of 2008 to the summer of 2009, and had a noticeable drag on the country's economy.
The monthly growth chart is also telling – while our country's GDP experiences small blips of negative growth, the month-to-month trend is an expansion usually between 0.1 and 0.6 per cent. Beginning in November 2008, Canada's GDP experienced seven straight months of contraction, shrinking by up to 20 billion dollars.
Jobs
The 2008 recession can easily be seen by charting Canada's unemployment as well.
Only six per cent of Canadians actively seeking work were unemployed in June of 2008, but by the same time next year, nearly nine per cent of the workforce was failing to find work. That percentage translated into an additional 500,000 people looking for work in the summer of 2009.
Over the next five years, unemployment levels slowly tapered back down to pre-recession levels, and were at around 6.6 per cent at the end of 2014.
Back to Top
Deficit / Surplus
Eliminating the federal deficit is often something promised by political parties in power and those fighting to be. Economists generally agree that shrinking a deficit and the amount of national debt is necessary in the long-term health of the nation.
But history shows the world economy is vulnerable to dips, sometimes big ones. Governments have to step in sometimes and take drastic action, and those actions cost money. After years of surplus, you can see from the chart below that the government went deep into deficit after the global financial crisis. In fact, the $56-billion worth of red ink in 2009-10 -- spending which was meant as a stimulus during the crisis -- was one of the largest deficits in modern Canadian history.
The figures above for 2015 and 2016 are current government projections.
Exchange Rate
The U.S.-Canada exchange rate tells us the price of our currency in relation to the U.S. currency. The chart below gives us what’s called a ‘direct quotation’ -- telling us how much a U.S. dollar costs in Canadian dollars.
While the financial factors which drive a currency up or down are complex, a currency generally rises as a result of increased demand for it on world markets. The loonie enjoyed near parity with the U.S. dollar in 2013, but that was before concerns over U.S. debt began to ease and our economic performance started to decline.
When the Canadian dollar goes down relative to the U.S. dollar, the loonie becomes more competitive because the price of our goods will be cheaper. That helps sectors like our manufacturers, exporters, and our hospitality and tourist industries.
When our dollar goes up relative to the U.S., we becomes less competitive, leading to larger imports of U.S. goods and services but lower exports of Canadian goods and services.
A strong dollar may mean employment numbers and per capital income is healthy. But it could also lead to a rise in inflation, and make it more expensive to buy things and to travel.
On balance, many economists think the closer to a 90-cent U.S. dollar we are, the better. It's what is considered to be 'fair value'.
Crude oil
With Canada being one of the top oil-producing countries in the world, the price of crude oil has a direct impact on Canada's economy.
Though 2014 prices have plummeted from summer prices of over $100 per barrel to southward of $50 coming into January 2015, the drop isn’t quite as steep as the industry experienced during the 2008 financial crisis.
Oil peaked at an all-time high of more than $140 per barrel in July of 2008 and then promptly bottomed out at around $33 by December.
Historically, however, these lows of the past decade are still relatively high in terms of cost per barrel. In 2000, for example, the highest price of oil was barely higher than the lowest price in 2008.
